For a lot of people, controlling their energy consumption in the house is equally important as controlling their lights alone. After all, only when you know when you consume most energy, and how much, you can effectively make a plan to save on energy in your home. This page describes the actions we have taken in our home to measure our usage of energy and present the information in dials or graphs.
Somewhere in the middel of 2014 Liander in the Netherlands installed a smart meter in our home, and after a while I decided to connect the P1 port to a RaspberryPI and start collecting information about Electricity Power and Gas consumption. The hardware specifics can be found in the Energy section.
Since LamPI version 2.1 we support Smart Meters. My Smart meter is a Landis-Gyr E350 and it is one of the latest models that outputs more than the averay amount of data.
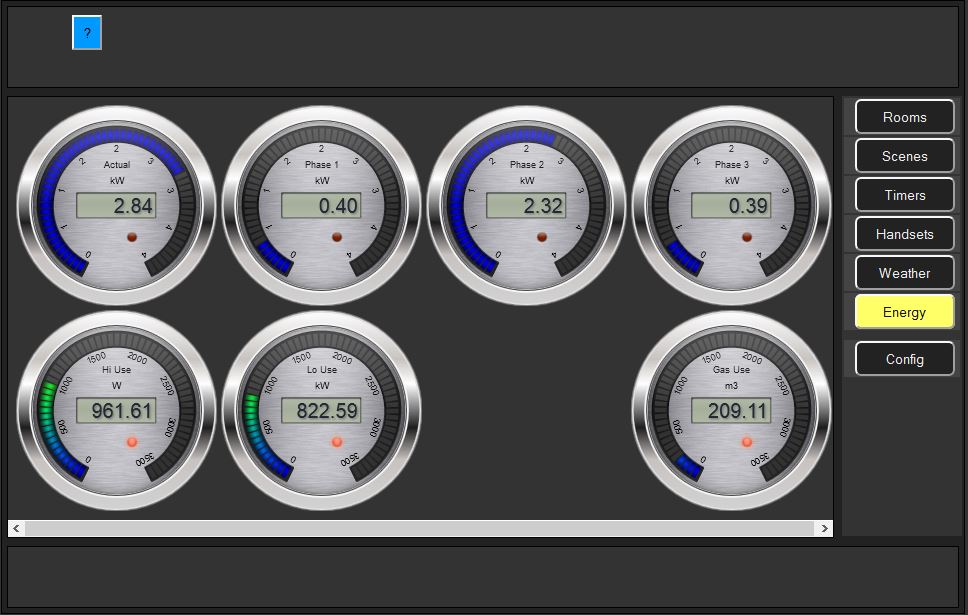
Below you see a screenshot of the energy screen... The snapshot was taken with the skin "blackngrey" as the active skin for the application.
When clicking in the weather screen on one of the dials, a separate screen will open that shows historical data for the weather sensors. This function is described separately in the section for rrd graphs.
The Json message that is sent to the LamPI-daemon is as follows:
message = {
tcnt : integer,
type : 'json',
action : 'energy',
brand: e350 # or another brand, you should use the same brand as in the database.cfg file
address: integer, # (For example the last 6 digits of your meter id number, in my case 083867)
channel: integer, # 0
kw_hi_use: char[12], # For double metering, the hi usage in kWhr
kw_lo_use: char[12], # For double metering the lo usage
kw_hi_ret: char[12], # Return to network
kw_lo_ret: char[12], # Lo return to network
gas_use: char[12], # Natural gas usage in m3
kw_act_use: char[12], # Actual momentary use (kW)
kw_act_ret: char[12], # Actual return
kw_ph1_use: char[12],
kw_ph2_use: char[12],
kw_ph3_use: char[12],
};
The LamPI-daemon will listen to all incoming json messages on its port 5000. Incoing messages from sensors will be matched against the configuration items in the database.cfg file for missing data such as names, location etc that are not sensor defined but defined by the user.
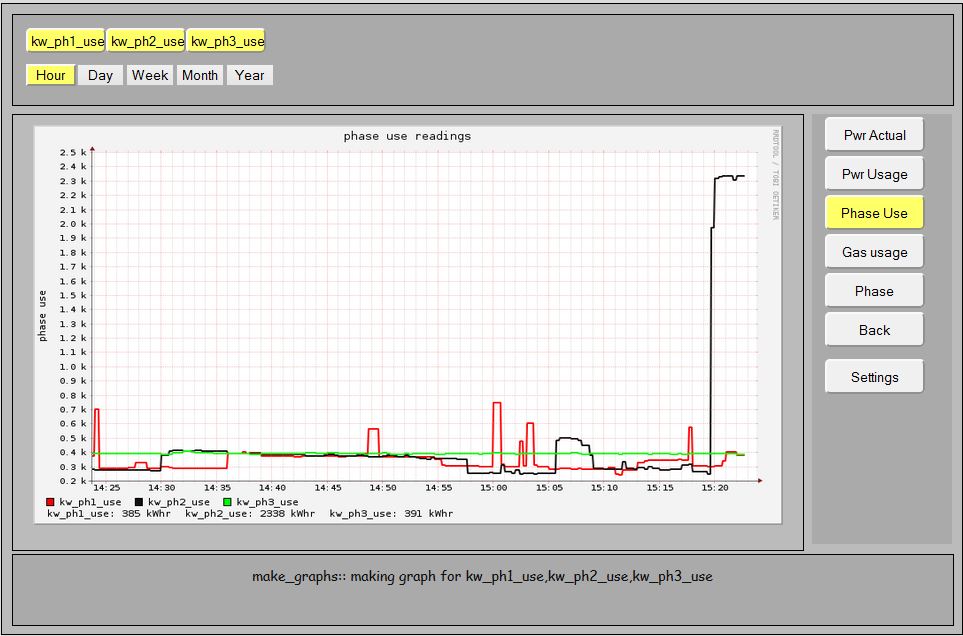
But in order to watch trends in data and analyze the collected data we need to add logging capabilities to the LamPI environment. There are several options:
The third option is attractive, as it will use external storage, services etc. to look at our data and the trend graphs are accessible from anywhere on the internet. The PAAS provider carriots.com provides this service for free for small users with up to 10 data streams.
The easiest method for analysing sensor data is to store all data collected to a local logfile on the PI, and import this file into excel on regular intervals. This is simple solution, and this also how I started.
There is a tools based on a round robin database tool that can be used to store sensors data and display graphs.
The PAAS (Platform As A Service) provider carriots.com provides a free membership for data analysis of a limited set of sensors.