All the sensor data that we collect can be used to show real-time sensor information on the screen. However, apart from showing this real-time info in gauges, sliders or other graphics, often sensor data makes most sense if users see trend lines over time. The rrdtool program enables making of nice graphs. RRDtool is written by Tobias Oetiker <tobi@oetiker.ch> with contributions from many people all around the world.
For this purpose, I included the rrdtool library into LamPI.
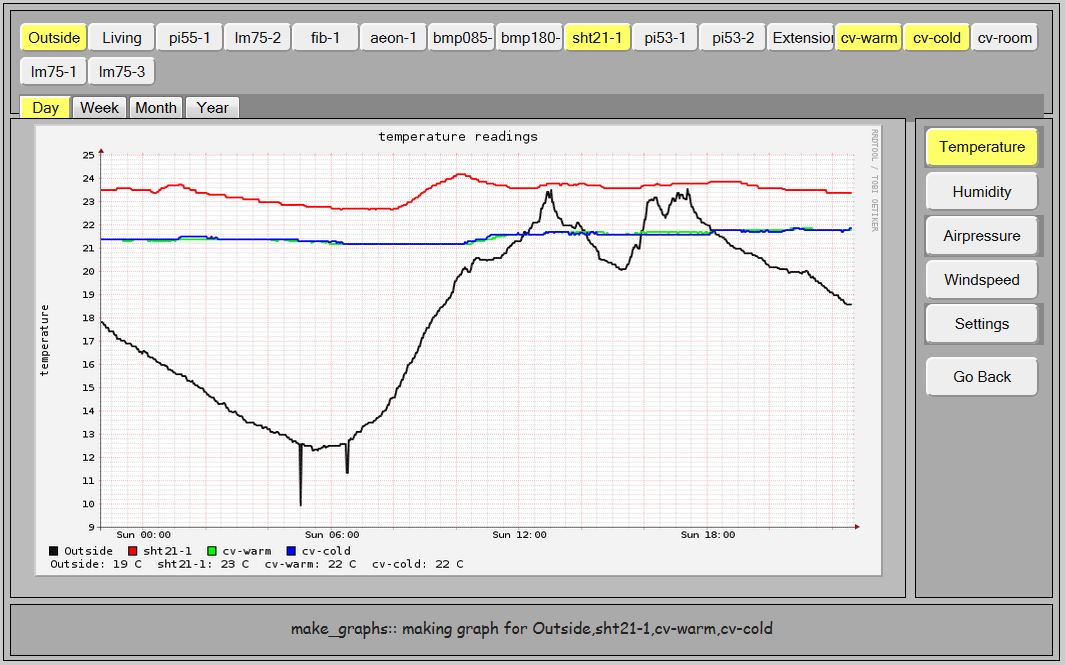
The screen print above shows 4 sensors during one day (June 28, 2015 aroun 22.30 hrs) and enables the used to compare the temperature readings of these ensors over the period of one day.
Before being able to define or even show sensor data in graphs, rrdtool and driver software needs to be loaded to the system.
sudo apt-get -y install python-smbus
sudo apt-get -y install python-dev
If all rrd software is installed, all sensors are working and we have a process in place to get sensor data in some form available by calling a script, then we are ready for the next steps: